Speed and Acceleration
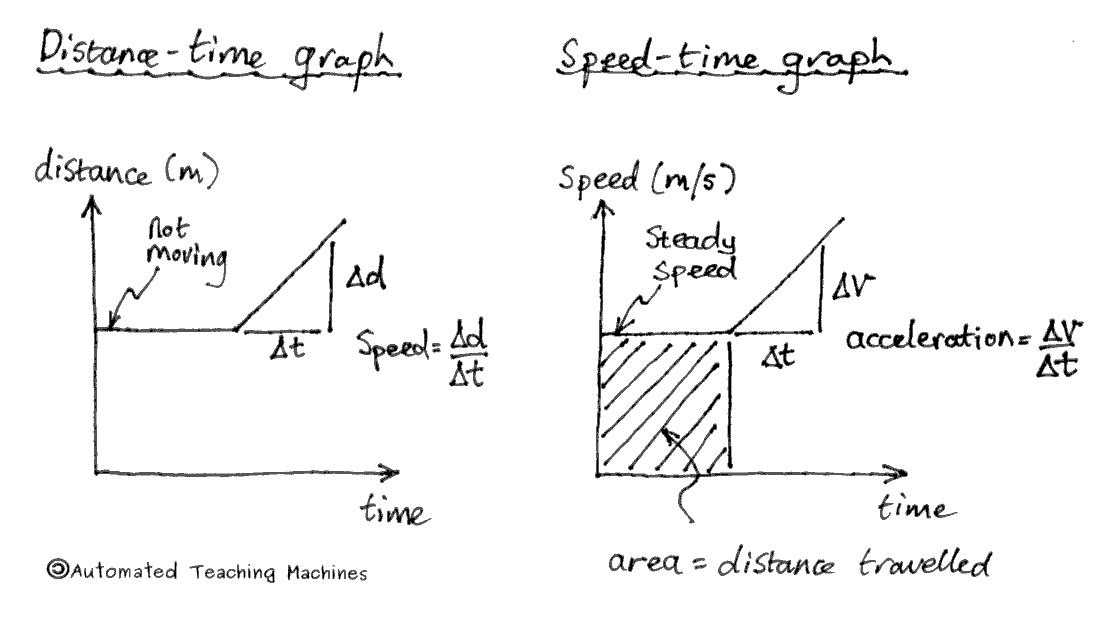
Speed is calculated using the equation speed=distance/ time.
A flat horizontal line on a distance-time graph shows that the object is not moving. The gradient of a sloping line tells us the speed of the object.
The acceleration of an object is the change in velocity (speed) divided by the time taken.
A flat horizontal line on a speed-time graph shows that the object is travelling at a constant (steady) speed. The gradient of a sloping line tells us the acceleration of the object. The area under a speed-time graph tells us how far the object has travelled.